- Home
- Inside Metro
- Performance Statistics
Performance Statistics
Let’s Do the Numbers:
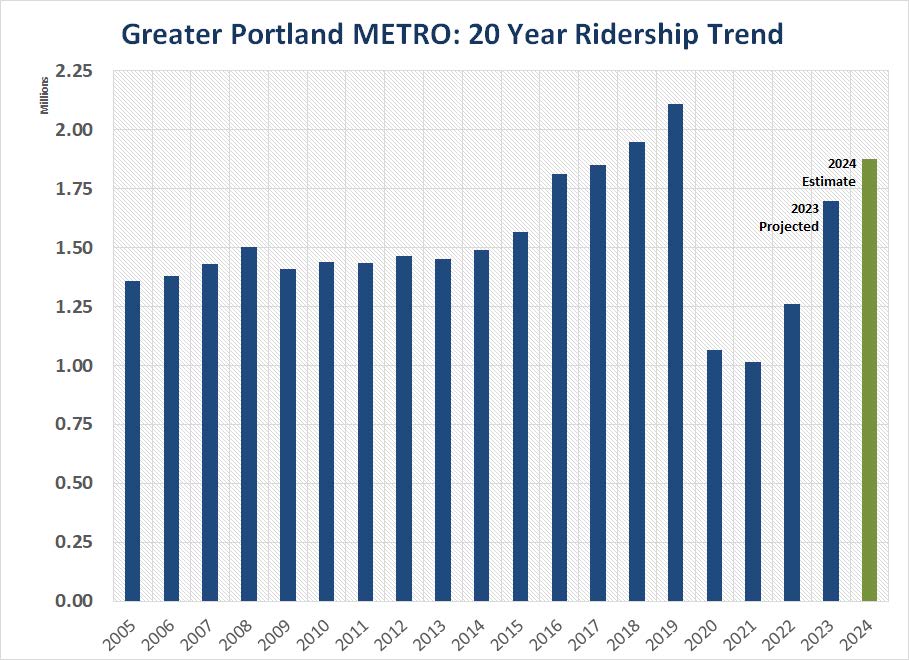
Annual Metro Ridership
2013 | 2014 | 2015 | 2016 | 2017 | 2018 | 2019 | 2020 | 2021 |
---|---|---|---|---|---|---|---|---|
1,452,363 | 1,489,116 | 1,568,136 | 1,810,825 | 1,850,686 | 1,947,038 | 2,111,521 | 1,088,817 | 1,016,885 |
Ridership in 2020 and 2021 have been significantly affected by the COVID-19 pandemic. Metro hopes to improve service in 2022 to encourage more ridership.
Ridership by Month and Route
Ridership improved significantly in Fall 2021 as schools largely returned to in-person learning for the first time since Spring 2020. Ridership is strongly correlated to the levels of service Metro operates on a given day of the week and throughout a typical day. On a route level, the Route 9, followed by Route 4 and Route 5, had the highest ridership in 2022.
2021 | ||||||||||||
---|---|---|---|---|---|---|---|---|---|---|---|---|
Weekday Boardings | Jan | Feb | Mar | Apr | May | Jun | Jul | Aug | Sep | Oct | Nov | Dec |
Route 1 | 5,642 | 5,402 | 7,043 | 6,842 | 6,831 | 8,110 | 8,547 | 8,669 | 8,341 | 8,136 | 7,651 | 7,883 |
Route 2 | 6,153 | 5,451 | 6,953 | 6,537 | 7,031 | 8,114 | 8,162 | 8,573 | 10,375 | 9,941 | 9,485 | 8,973 |
Route 3 | 3,477 | 3,198 | 4,385 | 4,770 | 4,777 | 5,381 | 4,700 | 4,947 | 4,791 | 4,727 | 4,307 | 4,408 |
Route 4 | 9,448 | 8,520 | 11,010 | 10,339 | 11,096 | 12,298 | 12,684 | 12,344 | 13,329 | 13,697 | 12,715 | 12,267 |
Route 5 | 8,626 | 8,040 | 10,055 | 9,187 | 8,553 | 10,178 | 11,364 | 12,158 | 12,631 | 12,683 | 11,265 | 11,232 |
Route 7 | 2,291 | 1,895 | 2,465 | 2,588 | 2,278 | 2,720 | 2,767 | 2,781 | 2,754 | 2,722 | 2,398 | 2,593 |
Route 8 | 4,437 | 4,316 | 5,320 | 5,092 | 4,707 | 5,271 | 5,372 | 5,597 | 5,551 | 5,252 | 5,330 | 5,565 |
Route 9 | 10,136 | 9,288 | 12,254 | 12,196 | 12,930 | 12,787 | 12,039 | 11,970 | 23,345 | 22,225 | 21,387 | 18,746 |
Breez | 1,279 | 1,238 | 1,864 | 2,001 | 1,961 | 2,372 | 2,662 | 2,864 | 3,222 | 2,819 | 2,773 | 2,378 |
Husky Line | 1,765 | 2,806 | 3,736 | 3,652 | 2,397 | 2,512 | 2,461 | 4,183 | 15,671 | 11,864 | 11,339 | 7,231 |
System | 53,254 | 50,155 | 65,086 | 63,204 | 62,562 | 69,743 | 70,757 | 74,086 | 100,010 | 94,066 | 88,649 | 81,277 |
Average Weekday | 2,663 | 2,508 | 2,830 | 2,873 | 3,128 | 3,170 | 3,216 | 3,368 | 4,762 | 4,479 | 4,221 | 3,534 |
Saturday | Jan | Feb | Mar | Apr | May | Jun | Jul | Aug | Sep | Oct | Nov | Dec |
Route 1 | 918 | 858 | 927 | 976 | 1,283 | 1,309 | 1,597 | 1,147 | 1,301 | 1,269 | 1,059 | 774 |
Route 2 | 580 | 495 | 552 | 644 | 749 | 789 | 750 | 791 | 746 | 920 | 666 | 429 |
Route 3 | 492 | 493 | 527 | 540 | 1,195 | 553 | 778 | 638 | 696 | 809 | 516 | 402 |
Route 4 | 1,486 | 1,183 | 1,351 | 1,524 | 1,836 | 1,471 | 2,176 | 1,548 | 1,725 | 1,961 | 1,488 | 994 |
Route 5 | 1,755 | 1,450 | 1,600 | 1,709 | 2,012 | 1,840 | 2,325 | 2,080 | 2,019 | 2,451 | 1,815 | 1,227 |
Route 7 | 477 | 403 | 468 | 567 | 649 | 541 | 798 | 491 | 466 | 579 | 432 | 318 |
Route 8 | 513 | 465 | 462 | 557 | 610 | 502 | 632 | 547 | 570 | 493 | 440 | 389 |
Route 9 | 935 | 835 | 940 | 880 | 1,342 | 1,136 | 1,541 | 1,247 | 1,299 | 1,306 | 1,505 | 802 |
Breez | 128 | 150 | 210 | 111 | 319 | 300 | 388 | 320 | 360 | 425 | 340 | 167 |
Husky Line | 227 | 240 | 334 | 349 | 328 | 261 | 358 | 291 | 599 | 487 | 406 | 219 |
System | 7,513 | 6,573 | 7,373 | 7,856 | 10,325 | 8,702 | 11,342 | 9,099 | 9,781 | 10,701 | 8,667 | 5,722 |
Average Saturday | 1,503 | 1,643 | 1,843 | 1,964 | 2,065 | 2,175 | 2,268 | 2,275 | 2,445 | 2,140 | 2,167 | 1,907 |
Sundays | Jan | Feb | Mar | Apr | May | Jun | Jul | Aug | Sep | Oct | Nov | Dec |
Route 1 | 428 | 345 | 363 | 315 | 655 | 583 | 425 | 765 | 535 | 686 | 497 | 441 |
Route 2 | 276 | 245 | 198 | 177 | 355 | 296 | 186 | 421 | 300 | 365 | 247 | 217 |
Route 3 | 232 | 193 | 213 | 115 | 465 | 225 | 151 | 319 | 258 | 304 | 212 | 197 |
Route 4 | 931 | 629 | 654 | 400 | 701 | 788 | 547 | 929 | 809 | 1,012 | 673 | 636 |
Route 5 | 992 | 857 | 886 | 550 | 1,125 | 986 | 647 | 1,325 | 1,049 | 1,253 | 833 | 758 |
Route 7 | 299 | 197 | 187 | 160 | 285 | 185 | 153 | 339 | 230 | 323 | 266 | 207 |
Route 8 | 406 | 277 | 279 | 202 | 335 | 387 | 223 | 424 | 326 | 412 | 263 | 293 |
Route 9 | 598 | 440 | 415 | 338 | 569 | 543 | 356 | 693 | 583 | 659 | 638 | 431 |
Breez | - | - | - | - | - | - | - | - | - | - | - | - |
Husky Line | 258 | 201 | 185 | 157 | 265 | 189 | 149 | 545 | 339 | 376 | 341 | 261 |
System | 4,420 | 3,383 | 3,380 | 2,414 | 4,756 | 4,182 | 2,836 | 5,760 | 4,427 | 5,390 | 3,970 | 3,441 |
Average Sunday | 884 | 846 | 845 | 805 | 951 | 1,045 | 945 | 1,152 | 1,107 | 1,078 | 993 | 860 |
Ridership by Route -- Line Chart
Maintenance
Any time a Metro bus needs to be serviced mid-run, a road call occurs. Metro's benchmark is to have road calls occur no less than 22,000 vehicle miles, on average systemwide.
2021 | |||||||||||||
---|---|---|---|---|---|---|---|---|---|---|---|---|---|
Jan | Feb | Mar | Apr | May | Jun | Jul | Aug | Sep | Oct | Nov | Dec | Total | |
Road Calls | 6 | 4 | 1 | 3 | 3 | 2 | 1 | 1 | 2 | 2 | 6 | 5 | 36 |
Mean Distance between Road Calls | 18,239 | 27,170 | 122,828 | 38,850 | 37,026 | 56,940 | 114,907 | 115,292 | 57,696 | 59,824 | 19,178 | 24,227 | 38,441 |
On-time Performance
A bus is considered to be on time if it leaves a time point between 0 and 5 minutes after its scheduled departure time. Target on-time performance is 90%. On-time performance typically lags during periods of heavy traffic, construction delays, heavy ridership, and other factors. On-time performance can be improved by prioritizing transit at traffic signals, providing bus lanes and queue jump lanes, improving boarding times, accommodating transit through construction zones, among other measures.
2021 | ||||||||||||
---|---|---|---|---|---|---|---|---|---|---|---|---|
Jan | Feb | Mar | Apr | May | Jun | Jul | Aug | Sep | Oct | Nov | Dec | |
Route 1 | 94.12% | 94.89% | 95.7% | 94.15% | 92.85% | 93.89% | 91.39% | 92.83% | 91.68% | 93.4% | 92.92% | 92.81% |
Route 2 | 92.66% | 92.9% | 93.05% | 84.37% | 79.64% | 80.56% | 80.33% | 83.15% | 74.98% | 79.66% | 84.89% | 86.3% |
Route 3 | 84.29% | 86.15% | 86.07% | 87.13% | 82.52% | 81.72% | 82.91% | 81.88% | 84.07% | 81.34% | 84.31% | 84.59% |
Route 4 | 92.78% | 92.25% | 90.84% | 90.24% | 89.99% | 89.83% | 88.43% | 91.26% | 86.93% | 84.65% | 89.28% | 89.15% |
Route 5 | 93.28% | 94.03% | 93.32% | 93.56% | 90.% | 89.21% | 88.52% | 86.11% | 89.98% | 88.9% | 91.46% | 90.25% |
Route 7 | 96.13% | 93.34% | 89.72% | 85.63% | 79.68% | 80.74% | 75.44% | 74.95% | 78.26% | 82.08% | 89.94% | 89.53% |
Route 8 | 97.86% | 96.96% | 94.44% | 95.01% | 91.66% | 93.21% | 88.58% | 89.17% | 90.39% | 91.15% | 94.91% | 92.81% |
Route 9A | 92.97% | 96.41% | 96.39% | 92.88% | 92.18% | 93.73% | 92.32% | 92.91% | 77.39% | 81.32% | 90.92% | 92.36% |
Route 9B | 94.81% | 94.09% | 93.4% | 88.75% | 83.41% | 84.87% | 82.79% | 80.28% | 85.88% | 87.05% | 89.49% | 87.34% |
Breez | 91.69% | 92.95% | 94.25% | 93.58% | 90.92% | 92.27% | 89.84% | 87.95% | 87.95% | 87.68% | 89.82% | 85.84% |
Husky Line | 92.42% | 94.99% | 95.1% | 94.29% | 88.8% | 86.25% | 80.87% | 85.97% | 85.69% | 85.35% | 87.45% | 90.13% |
System | 93.00% | 93.54% | 92.93% | 90.87% | 87.42% | 87.84% | 85.58% | 86.04% | 84.84% | 85.69% | 89.58% | 89.19% |
Customer Service
Metro tracks all complaints from customers. Complaints that are specific to the Americans with Disabilities Act (ADA) or Title VI of the Civil Rights Act (which prohibits discrimination on the basis of race, color, or national origin) are tracked separately and immediately elevated to the Executive Director. Most complaints fall under the "general" category and are typically resolved within a day.
Total Complaints | 2021 | |||||||||||
Jan | Feb | Mar | Apr | May | Jun | Jul | Aug | Sep | Oct | Nov | Dec | |
All Complaints | ||||||||||||
General | 16 | 6 | 7 | 13 | 15 | 14 | 5 | 6 | 19 | 9 | 6 | 9 |
ADA | 0 | 0 | 0 | 0 | 0 | 0 | 0 | 0 | 0 | 0 | 0 | 0 |
Title VI | 0 | 0 | 0 | 0 | 0 | 0 | 0 | 0 | 0 | 0 | 0 | 0 |
Total | 16 | 6 | 7 | 13 | 15 | 14 | 5 | 6 | 19 | 9 | 6 | 9 |
PER 100,000 BOARDINGS | Jan | Feb | Mar | Apr | May | Jun | Jul | Aug | Sep | Oct | Nov | Dec |
All Complaints | ||||||||||||
General | 24.5 | 10.0 | 9.2 | 17.7 | 19.3 | 16.9 | 5.9 | 6.7 | 16.6 | 8.2 | 5.9 | 10.0 |
ADA | 0.0 | 0.0 | 0.0 | 0.0 | 0.0 | 0.0 | 0.0 | 0.0 | 0.0 | 0.0 | 0.0 | 0.0 |
Title VI | 0.0 | 0.0 | 0.0 | 0.0 | 0.0 | 0.0 | 0.0 | 0.0 | 0.0 | 0.0 | 0.0 | 0.0 |
Total | 24.5 | 10.0 | 9.2 | 17.7 | 19.3 | 16.9 | 5.9 | 6.7 | 16.6 | 8.2 | 5.9 | 10.0 |
Safety
Metro tracks all accidents, including collisions, incidents occurring while passengers are boarding or departing the bus, incidents occurring on the bus itself, and other incidents. Each accident is analyzed by Metro staff and is determined to be preventable or non-preventable. Because the likelihood for accidents increases as levels of service increase, accidents are also tracked on a per-100,000-vehicle-mile basis to normalize the results for fair comparison from month-to-month and year-to-year.
Preventable Accidents | 2021 | |||||||||||
Jan | Feb | Mar | Apr | May | Jun | Jul | Aug | Sep | Oct | Nov | Dec | |
Collision | 4 | 4 | 4 | 6 | 5 | 3 | 3 | 7 | 5 | 7 | 7 | 2 |
Alighting | 0 | 0 | 0 | 0 | 0 | 0 | 0 | 0 | 0 | 0 | 0 | 0 |
Boarding | 0 | 0 | 0 | 0 | 0 | 0 | 0 | 0 | 0 | 0 | 0 | 0 |
On Board | 0 | 0 | 0 | 0 | 0 | 0 | 0 | 0 | 0 | 1 | 0 | 0 |
Other | 0 | 0 | 0 | 0 | 0 | 0 | 0 | 0 | 0 | 0 | 0 | 0 |
Total | 4 | 4 | 4 | 6 | 5 | 3 | 3 | 7 | 5 | 8 | 7 | 2 |
Preventable Accidents per 100,000 VM | 2021 | |||||||||||
Jan | Feb | Mar | Apr | May | Jun | Jul | Aug | Sep | Oct | Nov | Dec | |
Collision | 3.7 | 3.7 | 3.3 | 5.1 | 4.5 | 2.6 | 2.6 | 6.1 | 4.3 | 5.9 | 6.1 | 1.7 |
Alighting | 0.0 | 0.0 | 0.0 | 0.0 | 0.0 | 0.0 | 0.0 | 0.0 | 0.0 | 0.0 | 0.0 | 0.0 |
Boarding | 0.0 | 0.0 | 0.0 | 0.0 | 0.0 | 0.0 | 0.0 | 0.0 | 0.0 | 0.0 | 0.0 | 0.0 |
On Board | 0.0 | 0.0 | 0.0 | 0.0 | 0.0 | 0.0 | 0.0 | 0.0 | 0.0 | 0.8 | 0.0 | 0.0 |
Other | 0.0 | 0.0 | 0.0 | 0.0 | 0.0 | 0.0 | 0.0 | 0.0 | 0.0 | 0.0 | 0.0 | 0.0 |
Total | 3.7 | 3.7 | 3.3 | 5.1 | 4.5 | 2.6 | 2.6 | 6.1 | 4.3 | 6.7 | 6.1 | 1.7 |
Non-preventable Accidents | 2021 | |||||||||||
Jan | Feb | Mar | Apr | May | Jun | Jul | Aug | Sep | Oct | Nov | Dec | |
Collision | 2 | 5 | 2 | 2 | 6 | 3 | 5 | 3 | 4 | 1 | 2 | 4 |
Alighting | 1 | 0 | 0 | 0 | 0 | 1 | 0 | 0 | 1 | 0 | 1 | 0 |
Boarding | 0 | 0 | 2 | 1 | 0 | 2 | 2 | 0 | 0 | 0 | 0 | 0 |
On Board | 1 | 0 | 1 | 2 | 0 | 0 | 0 | 2 | 1 | 2 | 0 | 5 |
Other | 0 | 0 | 0 | 0 | 0 | 1 | 0 | 0 | 1 | 0 | 1 | 2 |
Total | 4 | 5 | 5 | 5 | 6 | 7 | 7 | 5 | 7 | 3 | 4 | 11 |
Non-preventable Accidents per 100,000 VM | 2021 | |||||||||||
Jan | Feb | Mar | Apr | May | Jun | Jul | Aug | Sep | Oct | Nov | Dec | |
Collision | 1.8 | 4.6 | 1.6 | 1.7 | 5.4 | 2.6 | 4.4 | 2.6 | 3.5 | 0.8 | 1.7 | 3.3 |
Alighting | 0.9 | 0.0 | 0.0 | 0.0 | 0.0 | 0.9 | 0.0 | 0.0 | 0.9 | 0.0 | 0.9 | 0.0 |
Boarding | 0.0 | 0.0 | 1.6 | 0.9 | 0.0 | 1.8 | 1.7 | 0.0 | 0.0 | 0.0 | 0.0 | 0.0 |
On Board | 0.9 | 0.0 | 0.8 | 1.7 | 0.0 | 0.0 | 0.0 | 1.7 | 0.9 | 1.7 | 0.0 | 4.1 |
Other | 0.0 | 0.0 | 0.0 | 0.0 | 0.0 | 0.9 | 0.0 | 0.0 | 0.9 | 0.0 | 0.9 | 1.7 |
Total | 3.7 | 4.6 | 4.1 | 4.3 | 5.4 | 6.1 | 6.1 | 4.3 | 6.1 | 2.5 | 3.5 | 9.1 |
Greater Portland Transit District METRO
Annual National Transit Database (NTD) Profile Reports