
Performance Statistics
Metro tracks various metrics on a monthly and annual basis in order to measure the growth and performance of the system.
Ridership
Ridership Count
Metro ridership peaked in 2019 with over 2.1 million trips in the system. The COVID-19 pandemic resulted in significant shifts in commuting and travel behavior, including a significant shift toward working from home and avoiding crowded, enclosed spaces. As a result, ridership dropped dramatically beginning in March 2020, and has not fully recovered. Currently, Metro monthly ridership is about 64% of 2019.
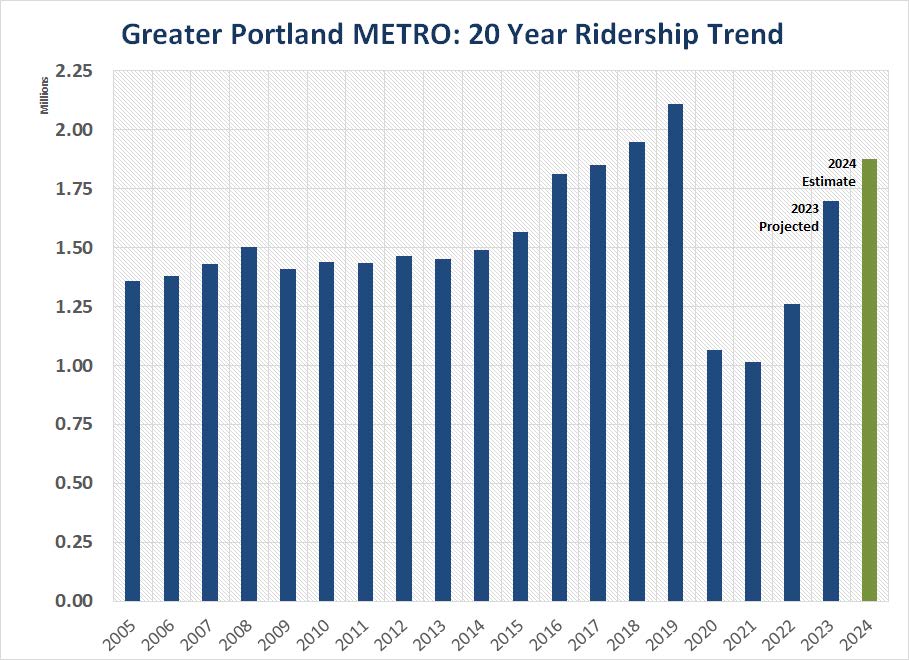
Ridership Recovery
Like most transit systems across the US, Metro ridership is slowly recovering from the COVID-19 pandemic and how it caused unprecedented and relatively sudden changes to how people work, commute, and recreate.
At the start of the pandemic, ridership plummeted as many offices were closed, restaurants became take-out only, and social events were canceled. METRO was fare-free from April to October 2020 as a public safety measure. When METRO resumed charging fares with its new fare payment system in October 2020, ridership settled at about 40% of prepandemic totals for about 8 months, before vaccines became widely available and people began to work in offices and socialize in person again.
Unfortunately, bus ridership has not recovered as quickly as other modes. Since the spring of 2021, ridership has recovered steadily but slowly.
Ridership Per Revenue Hour
While ridership is a useful metric for system performance, it doesn’t tell the whole story. The true performance of the system, and individual routes, accounts for ridership as well as the amount of service supplied. Routes that have high ridership per revenue hour are considered “efficient”, providing a large return on investment. Routes with lower ridership per revenue hour may not be as efficient, but they may provide other benefits, such as serving a more transit-dependent populations, or carrying passengers for a longer distance.
Fleet Performance
On-Time Performance
On-time performance is a key metric for any transit agency, providing a snapshot of how reliable service is in a given time period and a given route. Routes that run on time are more reliable for its passengers, while routes that are consistently late are difficult to rely on for getting to jobs or appointments on time. For the purposes of on-time performance, a bus is considered “on time” if it leaves a timepoint between 0 and 5 minutes after the time indicated on the schedule. This minor level of flexibility helps account for fluctuations in traffic. Buses should never leave a stop earlier than the scheduled time.
Metro aims for on-time performance of at least 90% for each route and for the system as a whole. On-time performance is affected seasonally due to construction, congestion and weather/road conditions. If a route is consistently performing poorly, Metro makes adjustments to schedules. Infrastructure improvements, such as transit signal priority, improved bus stops, bus lanes, etc. can improve on-time performance.
Fuel Efficiency
Metro tracks the fuel efficiency of every vehicle in our fleet for every day of operation in a given calendar year. This allows us to track how vehicles are performing and make educated decisions about our existing fleet and future bus procurements.
Like a typical passenger vehicle, the fuel efficiency of buses is affected by numerous factors. Buses are heavy, stop much more often than most vehicles, and tend to put in many more miles on city streets than on highways. For these reasons, Metro diesel buses typically have a fuel efficiency of about 5 miles per gallon (MPG). Compressed natural gas (CNG) buses are similarly efficient to diesel. Battery electric buses (BEB’s) do not use liquid fuel, but their peak fuel efficiency is four to five times better than their diesel counterparts. BEB’s perform best during the late spring and early fall, when energy is not needed for heat or air conditioning.
Fuel efficiency can vary throughout the year based on several factors, including traffic, weather, and the age of the vehicle fleet in a given fuel type.